
September 2026 · 735,435 bags of 60 kg
MAAIF Coffee Department · September report ↗VERIFIED TRADE INFRASTRUCTURE
THE VERIFICATION
INFRASTRUCTURE
FOR GLOBAL TRADE.
Get structured. Get verified.
Access international markets with your Verified Trade Passport.
We build trust through verified supplier evidence, helping buyers assess suppliers with confidence and suppliers access global markets.
✧ Powered by AI
AFRICAN SUPPLIERS.
GLOBAL OPPORTUNITY.UK / EU / Middle East / & beyond
GLOBAL OPPORTUNITY.UK / EU / Middle East / & beyond
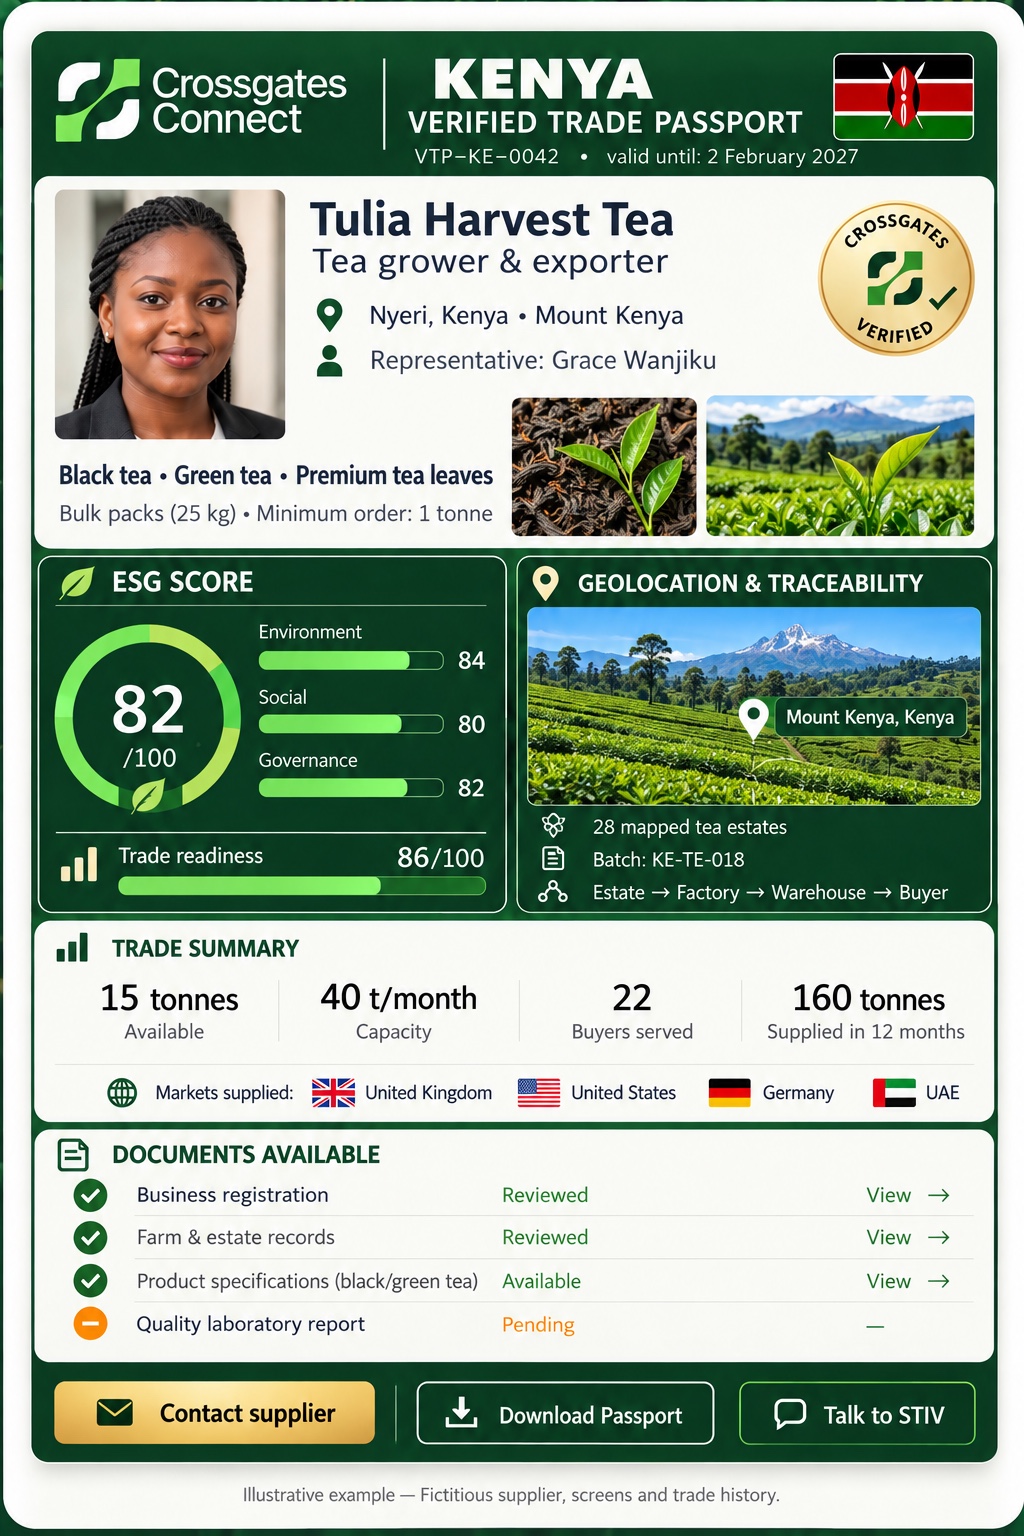
YOUR EVIDENCE. ONE PASSPORT.Sample Passport · fictional supplier
01 / EXPERIENCE THE PRODUCT
From scattered records
to a clearer decision.
Choose a sample. See the gaps.
Generate a buyer-readable view.
01
Start with the evidence
Toggle the sample records to see how gaps affect the Passport.
This demo organises selected sample data locally. It does not validate an entity or contact an issuer.
02 / STIV
Structure.
Structure.
Connect.
Surface gaps.
AI-assisted workflow concept
Ready to explore03
A buyer-readable record
SAMPLE PASSPORT
Nile Harvest Coffee
DEMO-UG-8842
67%
Evidence coverage
2 of 3 sample categories
Coverage, not export approvalSample data only. No verification badge is issued.
One record, two perspectives.
Suppliers see what is present, what is missing and what to do next.
Start your preparations ↗02 / FROM SUPPLIER EVIDENCE TO BUYER CONFIDENCE
How evidence becomes a
Verified Trade Passport.
Organise your records. Understand the gaps. Give buyers a clearer basis to assess your business.
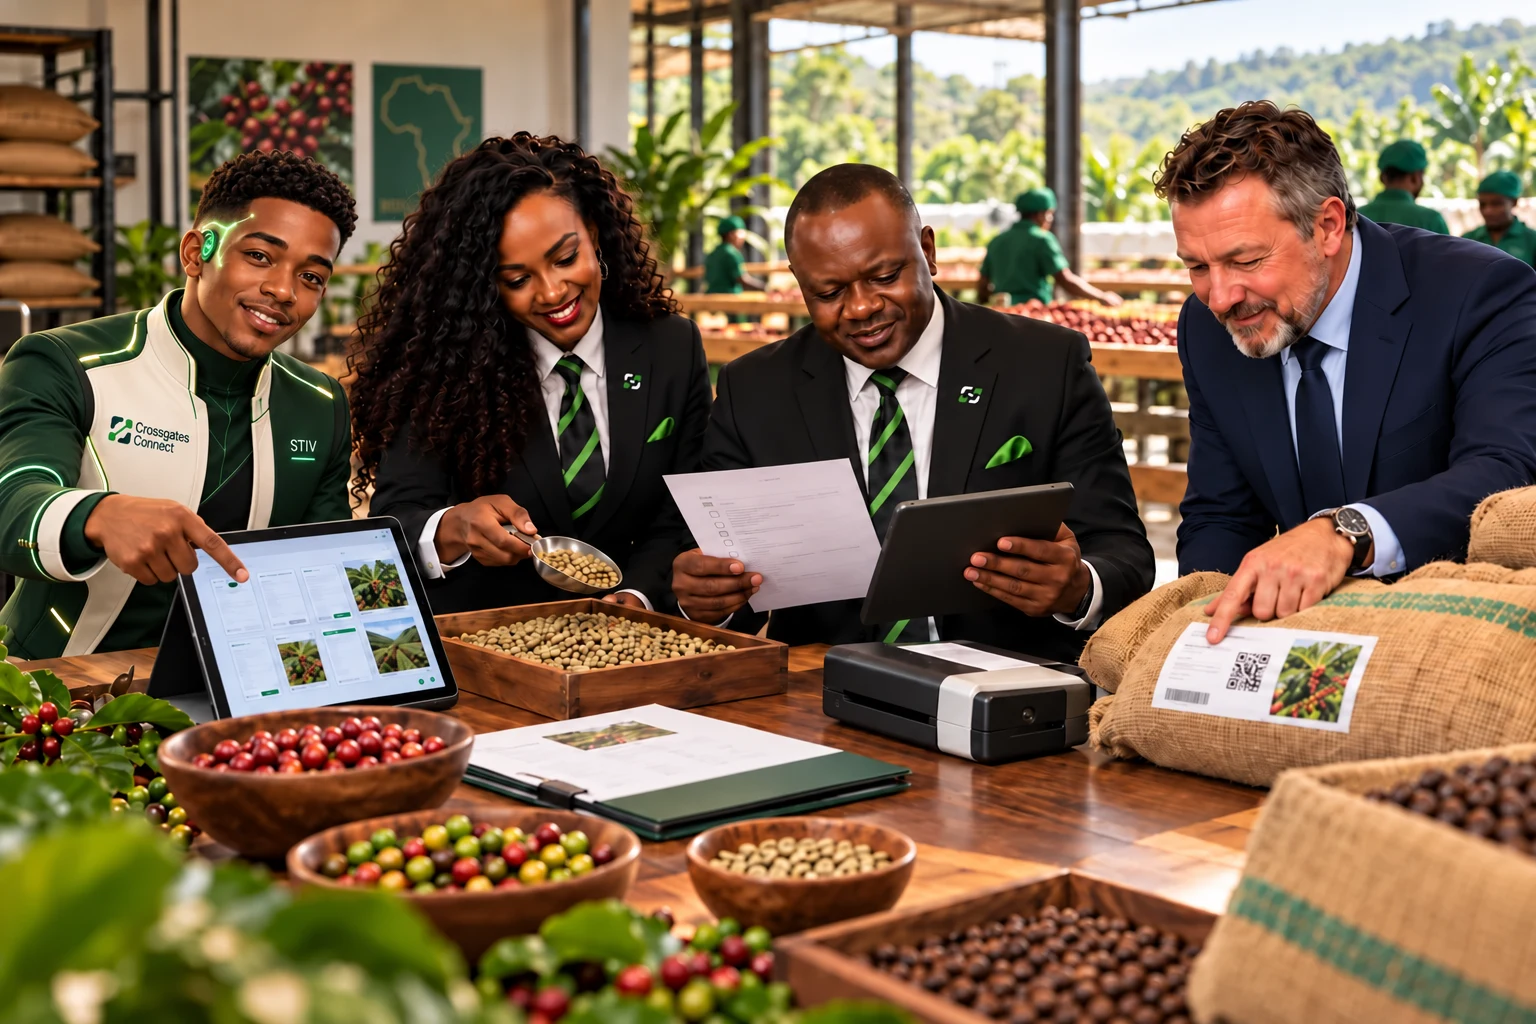

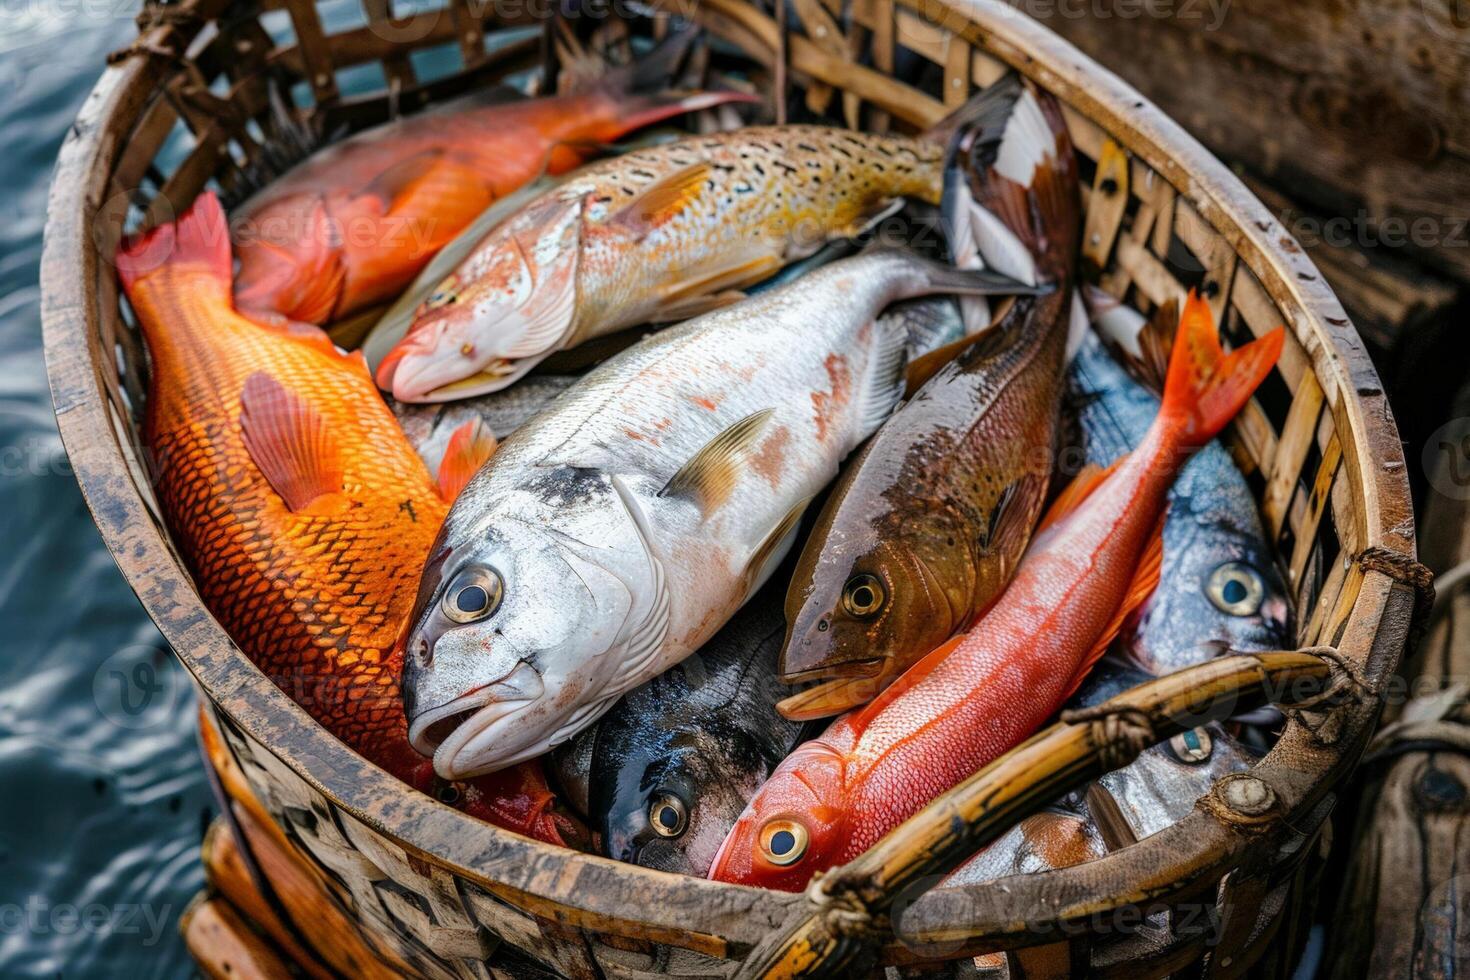
Illustration of the evidence-review workflow.
01 · ORGANISE
Start with supplier evidence
Bring business, product and compliance records into one supplier profile. STIV helps identify what is missing.
02 · CHECK
Connect documents to their source
Record the issuer, reference and validity. Where available, cross-check details against authoritative sources.
03 · REVIEW
Make the strength of each check clear
Show the check performed, its scope and unresolved issues. Reviewed evidence is distinct from issuer confirmation.
04 · PRESENT
Build a buyer-readable passport
Bring identity, evidence and outstanding actions into one record. Buyers can then request access to supporting documents.
Make the next step clear.
I’m a supplier →I’m a buyer →Prepare your supplier record or explore the evidence a buyer needs.
03 / AGRIBUSINESS MARKET INTELLIGENCE
Africa grows it.
The world buys it.
Start with Uganda and Kenya. Explore the products, the buying markets and the evidence that helps supply become opportunity.
RESEARCH SNAPSHOT · 02 NOV 2026 Published statistics · not a live price feed
UGANDA COFFEE US$186.92m SEP 2026KENYA TEA KSh14.8bn AUG 2026KENYA HORTICULTURE KSh15.52bn JUL 2026UGANDA COCOA US$632.34m 2025UGANDA FROZEN FILLETS US$36.38m 2025UGANDA VANILLA US$16.19m 2025KENYA AVOCADOS US$160.14m 2025
01 / OUR STARTING POINT
Uganda → Kenya → Africa
The harvest is only the beginning. A Ugandan coffee business may have a lot ready to sell. A Kenyan grower may have fruit ready to ship. Before a buyer can assess either offer, product identity, available volume and supporting records need to tell one consistent story. Crossgates helps make that story inspectable.
See the evidence journey →49,900 tonnes · August 2026 · rounded published figures
KNBS · August dashboard ↗87,972 tonnes · July 2026 · includes flowers, fruits and vegetables
Central Bank of Kenya · monthly series ↗THE MONTHLY PULSE
Kenya’s export receipts
March–July 2026 · KSh billion. Select a series to see the pattern, rather than a single headline.
02 / FOLLOW THE PRODUCT
Who sells. Who buys.
Where the opportunity sits.
Newer regional figures alongside a consistent 2024 global benchmark · US dollars · top reporting countries in the linked WITS tables. These are country markets, not verified company buyers or Crossgates partners.
Read or download the regional figures · reviewed 2 November 2026
| Product | Exporter | Period | Value | Quantity | Evidence |
|---|---|---|---|---|---|
| Sesame seeds | Uganda | 2025 | US$33,946,090 | 19,314.2 tonnes | Source ↗ |
| Cocoa beans | Uganda | 2025 | US$632,337,820 | 76,662.4 tonnes | Source ↗ |
| Coffee | Uganda | September 2026 | US$186,915,225 | 735,435 bags · 60 kg per bag | Source ↗ |
| Vanilla | Uganda | 2025 | US$16,188,810 | 455.241 tonnes | Source ↗ |
| Other dried fruit | Kenya | 2025 | US$3,412,700 | 5,885.73 tonnes | Source ↗ |
| Avocados | Kenya | 2025 | US$160,140,510 | 120,893 tonnes | Source ↗ |
| Fresh/chilled peppers | Kenya | 2025 | US$2,967,450 | 2,012.77 tonnes | Source ↗ |
| Frozen fish fillets | Uganda | 2025 | US$36,378,310 | 5,141.64 tonnes | Source ↗ |
Download regional figures and company sources (JSON) ↓
Monthly figures are released after the reporting month. Annual figures are historical trade totals. Moving numbers are a presentation of those published figures, not a continuously updating price feed.
What these numbers mean · sources & coverage
World Bank WITS / UN Comtrade, 2024 annual gross trade values. Rankings exclude the EU aggregate to avoid counting it alongside member countries. Re-exports are included; an exporting country is not necessarily the growing origin. Reporting gaps can change rankings: these are the leading reporters in each source table, not a complete worldwide league table. Import values and export values use different valuation bases and should not be added together.
Fresh fruit is represented by avocados; vegetables by fresh/chilled capsicum and pimenta peppers; fish by frozen fillets; nuts by cashews. These examples are not totals for their wider sectors. Other dried fruit excludes separately classified dried fruits such as raisins. Annual data is deliberately separated from 2026 monthly indicators. The regional update uses 2025 annual records and available 2026 monthly releases, each individually dated. These figures are published research snapshots, not a live API feed.
Download the underlying ranking snapshot (JSON) ↓04 / THE GAP CROSSGATES WORKS ON
Supply is there.
Make the evidence travel.
01
Supplier evidence
Business records, product information and source documents.
The gap: buyers cannot assess what they cannot see02
Verified Trade Passport
One record showing what was checked, the source and what remains open.
The response: evidence, gaps and next actions together03
Buyer assessment
Examine the evidence and request the supporting documents.
The outcome we aim for: buyer confidenceStart in Uganda and Kenya. Build towards wider African agricultural trade—with transparent evidence, not unsupported promises of approval or sales.
Africa-wide ambition
Explore a sample supplier record →East, West, Central, Southern and North Africa. The market explorer connects East African exports with cocoa from Côte d’Ivoire and Nigeria, vanilla from Madagascar, and the wider fruit, vegetable and fish trade. Our expansion ambition is not a claim of current operations in every country.
STRUCTURED EVIDENCE. CLEARER NEXT STEPS.
Make your next trade conversation
an informed one.
About the interactive sample +
Explore the evidence workflow
Choose sample records, compare Exporter and Buyer views, explore evidence gaps, and print a sample Passport.
Sample data, clear boundaries
The demonstration uses fictional supplier records. It does not perform KYB/KYC, sanctions or issuer checks, process real documents, issue certification or create an account. Sign in to access the platform.